Single coronal image through dominant tumor mass on left side of abdomen.
Tumor shows bright orange uptake of glucose:
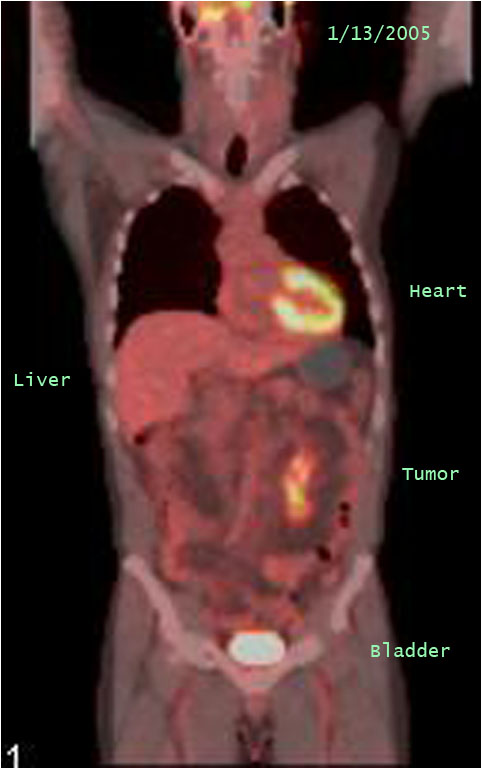
PET / CT exam 1/13/2005
Single coronal image through dominant tumor mass on left side of abdomen.
Tumor shows bright orange uptake of glucose:
CT abdomen and thorax exams 4/27/2005:
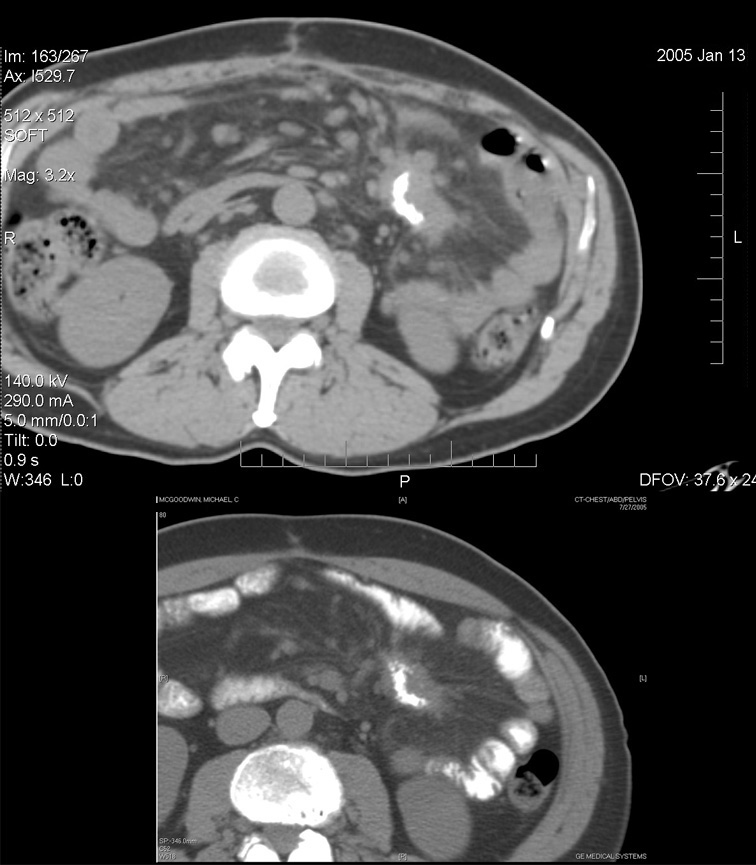
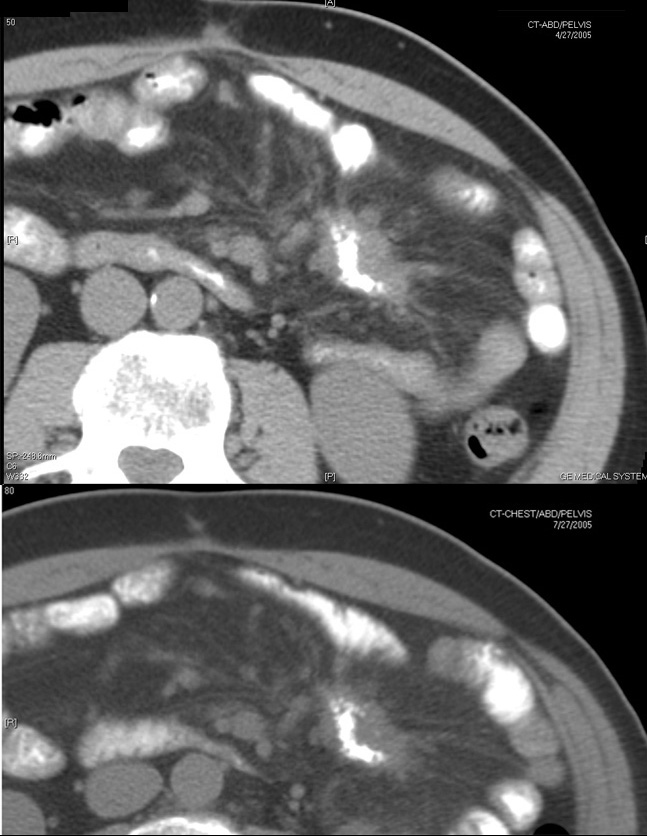
 Abdomen: Axial images through dominant tumor mass in left abdomen, comparing 1/13/2005 and 4/27/2005 (Tumor has heavy calcification from necrosis showing as bright white blotches.) |
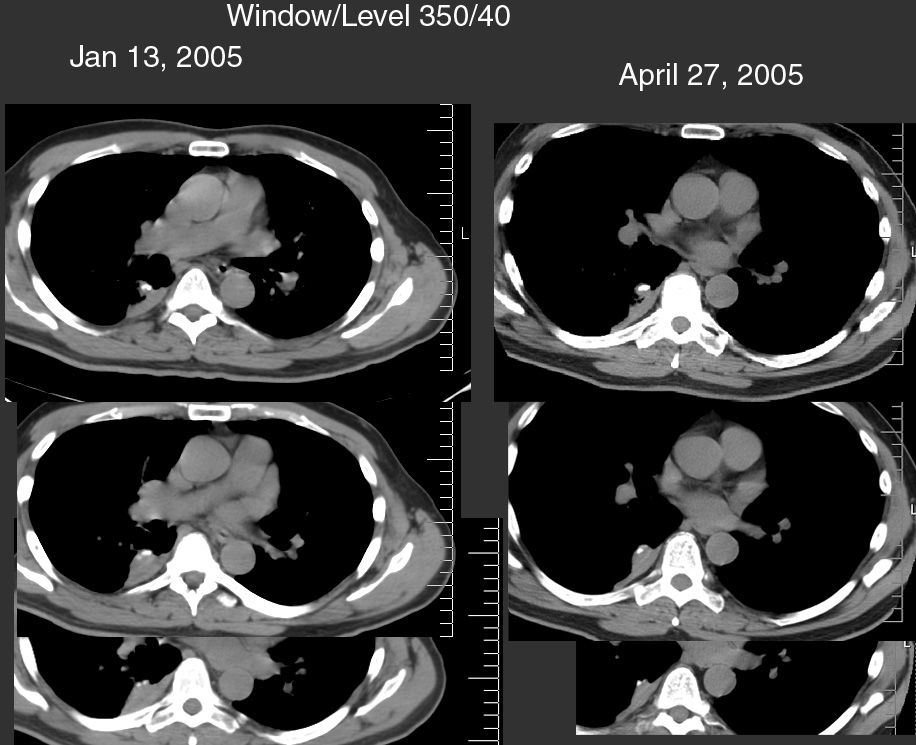 Thorax: Axial images through right lower lobe lung lesion, comparing 1/13/2005 and 4/27/2005. (Is this scar versus tumor in the thorax?—see below) |
CT abdomen and thorax exams 2/1/2006:
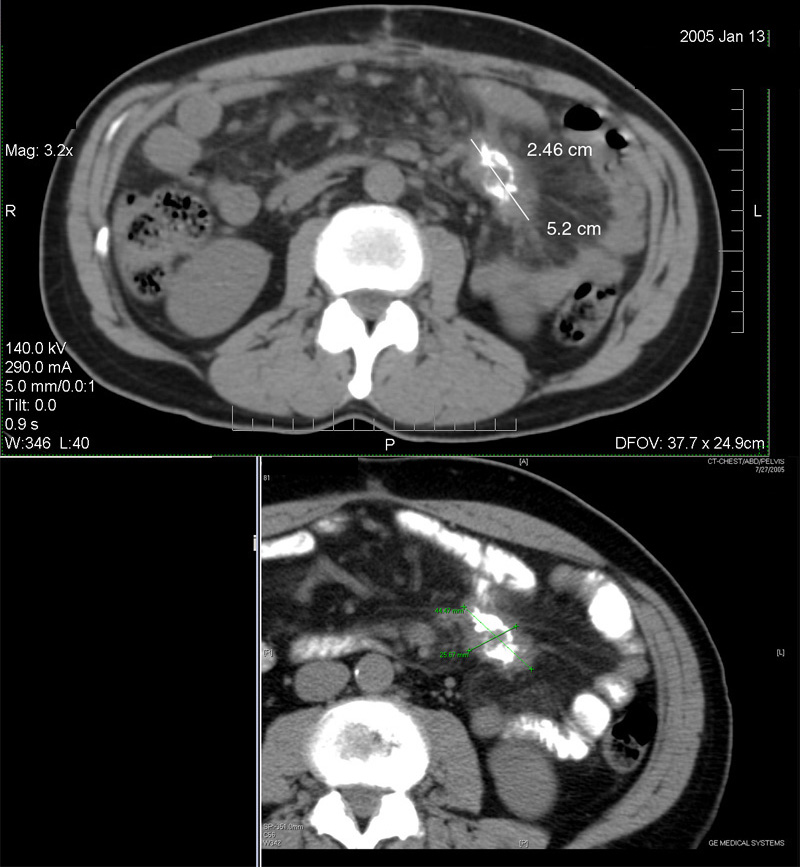
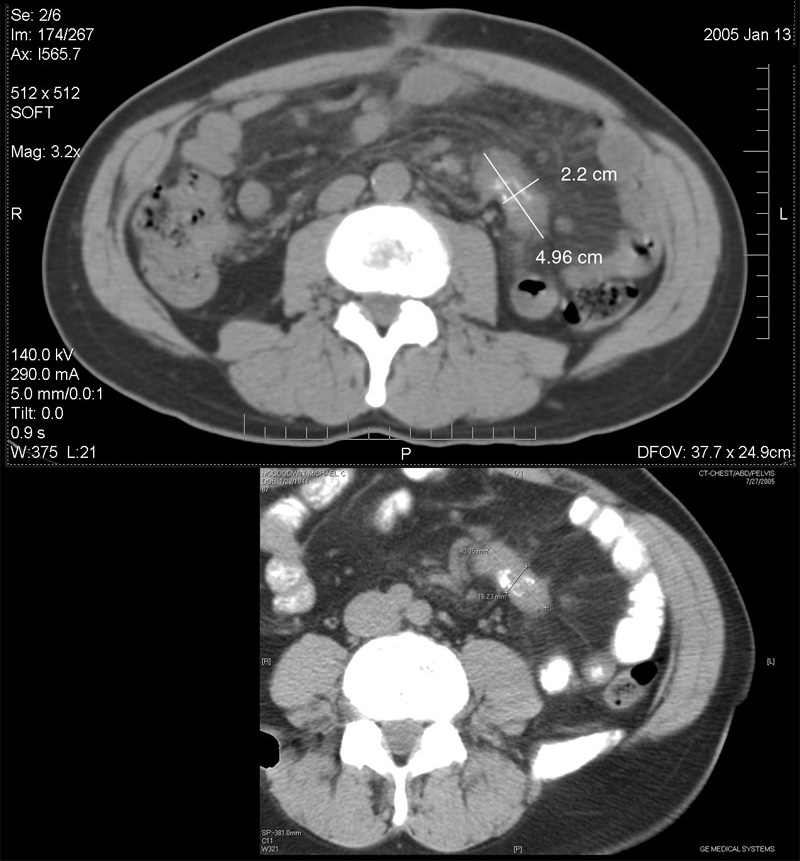
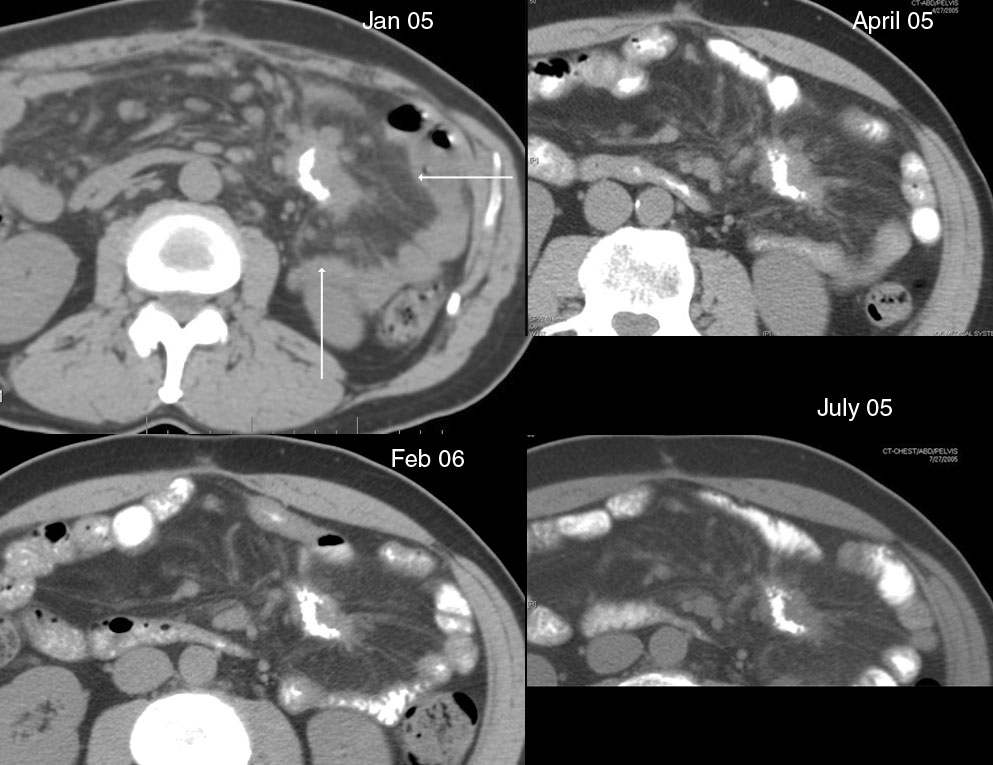 Axial images through dominant tumor mass in left abdomen, comparing 1/13/2005, 4/27/2005, 7/27/2005, and 2/1/2006 (Level One) (Shows shrinkage of dominant mass and shrinkage of enlarged lymph nodes from chemotherapy from 1/13/05 to 7/27/05, but no change since 7/27/05. (The irregular bright white calcification is not expected to change.) |
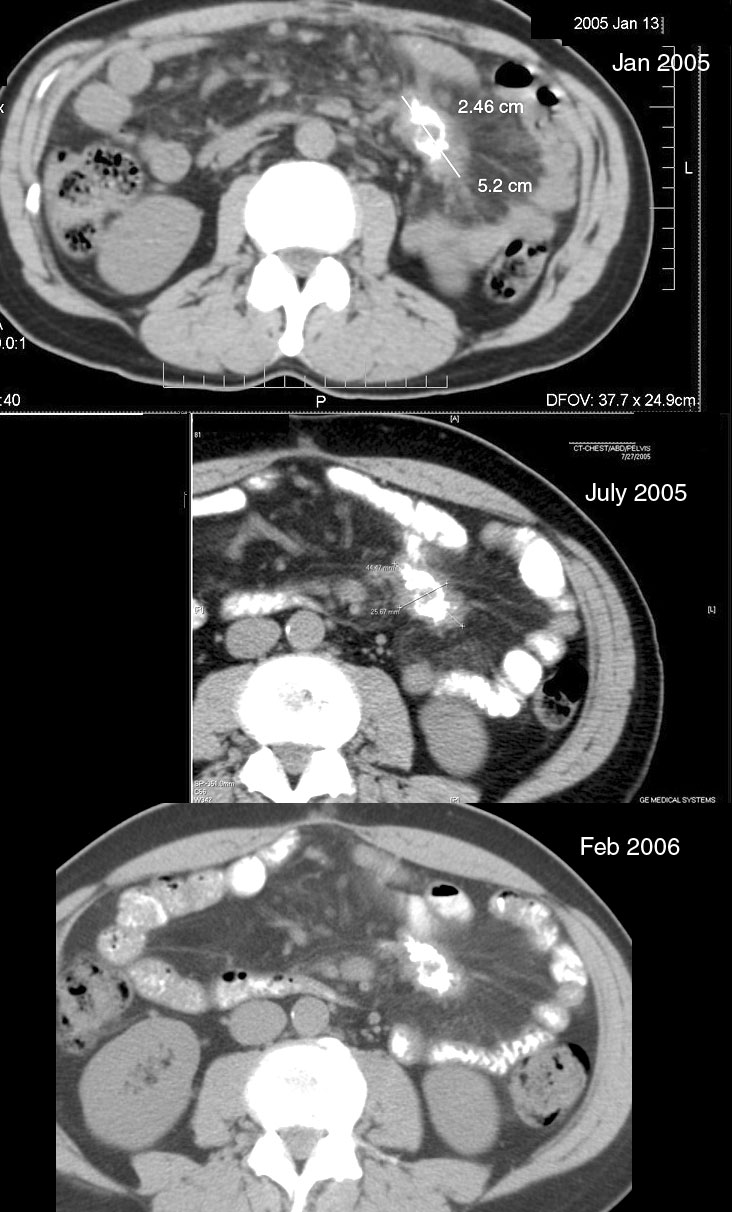 Axial images through dominant tumor mass in left abdomen, comparing 1/13/2005, 7/27/2005, and 2/1/2006 (Level Two) |
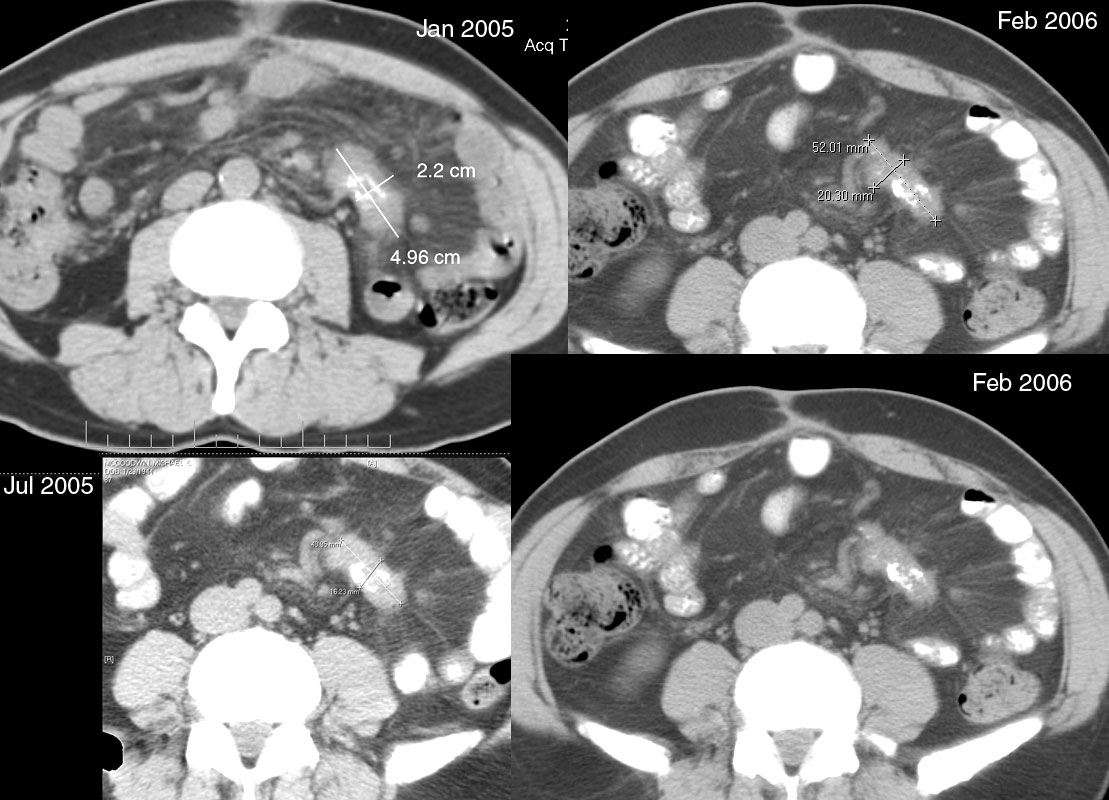 Axial images through dominant tumor mass in left abdomen, comparing 1/13/2005, 7/27/2005, and 2/1/2006 (Level Three) |
 Coronal image through dominant tumor mass in left abdomen 2/1/2006 |
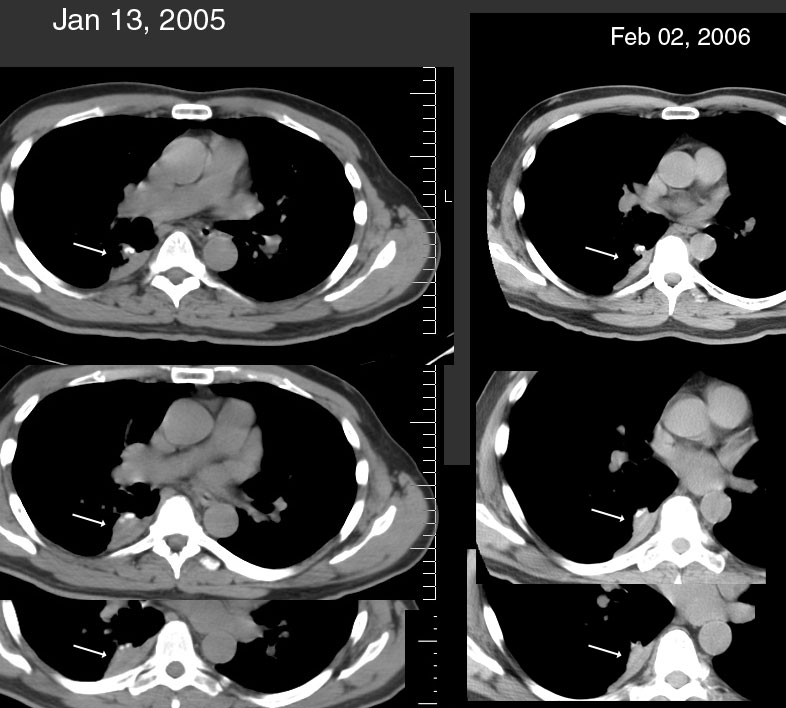 Thorax: Axial images through right lower lobe lung lesion, comparing 1/13/2005 and 2/1/2006. (Shows possible minimal regression of lesion thickness during chemotherapy since 1/13/05, raising the question that lesion was tumor despite former low uptake on PET.) |
|
CT exam of chest, abdomen, and pelvis 1/25/2007
Single coronal image through dominant tumor mass on left side of abdomen.
The partially calcified tumor shows no evidence of progression
or further regression
or other significant change:
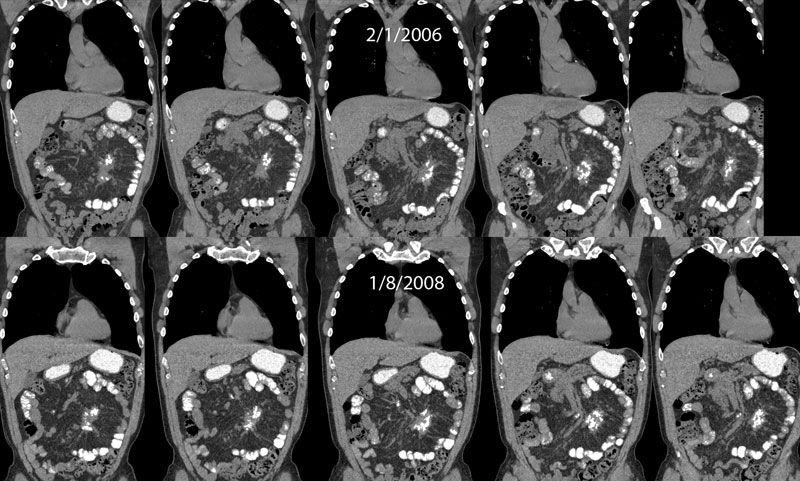
CT exam of chest, abdomen, and pelvis 1/8/2008
Coronal images through dominant tumor mass on left side of abdomen.
The partially calcified tumor in 2008 (bottom row) shows no evidence of progression
or further regression
when
compared to similar images in 2006 (top row).
(This lesion was not further changed on subsequent CT scans
performed on 1/13/2009 and 1/19/2010.):

Page mcgoodwin.net/mcm/lem/lem.html
Created by Michael McGoodwin
Last update to this page: 28 Oct. 2022
![]()